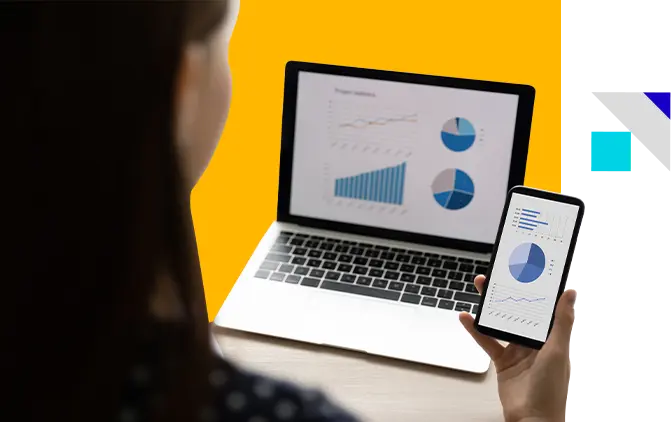
Turn HR data into actionable insights
Don’t get lost in rows and columns. Stay up-to-speed with our unified people analytics platform

Don’t get lost in rows and columns. Stay up-to-speed with our unified people analytics platform


Make sense of large data sets and present insights for actionable decision-making

Cockpit view of all employee data in real-time

Uncover insights that matter

Interactive view for your people data

AI-powered actionable insights

Win stakeholder buy-in with easy-to-understand charts & reports

Single view of data to drive planning aligned with business goals

Securely collects information from systems of record with GDPR compliance
 superapp to manage people, processes, and EX. talent-focused enterprise.
29 out-of-the-box dashboards on HR demographics, leave and attendance, attrition, recruitment, learning and performance, and much more

75 different ways through which a user can create personalised dashboards

Make use of 178 different types of filters on top of your data charts for a personalised view of data
Enterprises
Countries
Users
Gartner's voice of customer report 2022-2024
Product Stack


Enterprises
Countries
Users
Gartner's voice of customer report 2022-2024
Enterprises
Countries
Users
Gartner's voice of customer report 2022-2024
Enterprises
Countries
Users
Gartner's voice of customer report 2022-2024
Enterprises
Countries
Users
Gartner's voice of customer report 2022-2024
Enterprises
Countries
Users
Gartner's voice of customer report 2022-2024
Enterprises
Countries
Users
Customers' Choice in 2023 Gartner Peer Insights 'Voice of the Customer' Report